| Annular Solar Eclipse: light curve |
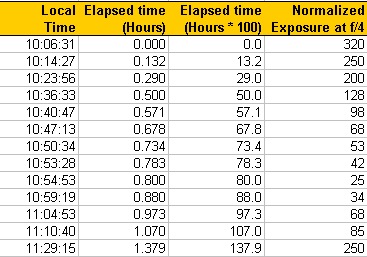
Figure #1: Processed data. Exposures values (shutter speed and f-stop) were normalized for f/4
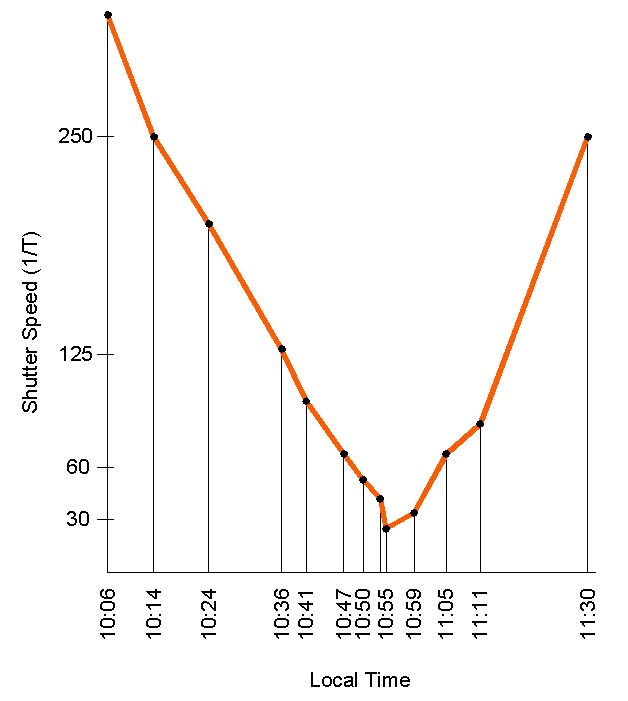
Figure #2: Light Curve: Note some irregularities probably due to some deviations while gathering the
experimental data. In any case, the overal behavior of light intensity along the eclipse is clear
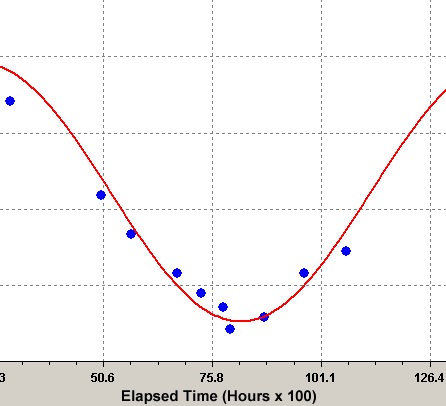
Figure #3: Fit of data using CurveExpert Software
Just click here to download the raw
data and performed calculations in MS Excel format